Archived analysis work. My current focus is here: rasmuskampmann.com.
Software Detection ML Model
A model is only as good as the features under it. This one predicts accounting-software adoption from public Danish company-registry data alone, no paid data vendor, and reorders the cold-outbound dialler queue before reps make a single call.
Deployed as a score boost in the lead-scoring pipeline, reordering the queue automatically every morning and retraining itself monthly. Built on 4,658 training rows of public registry data. Reproducible on a 5,000-row synthetic dataset.
I built a model that reorders the cold-outbound queue at a Danish SMB accounting firm. Every morning, before the first call goes out, the highest-probability prospects move to the top. No manual prospecting, no paid data vendors. Just public registry data and a binary classifier.
The reps never change how they work. They open the dialler and call from the top, the same as always. The only thing that changed is the order, and the order now puts the most-likely-to-fit companies first. The model separates the two classes meaningfully better than chance: holdout AUC 0.75, permutation test p < 0.0001. It runs as a score boost inside the existing pipeline and retrains itself every month.
Want the technical deep-dive: training script, feature engineering, evaluation charts? See the GitHub case study.
Context
A Danish SMB accounting firm runs cold outbound through an autopilot dialler. The queue gets generated, the dialler works through it, reps pick up calls as they connect. There’s no manual prospecting between the queue and the call. Whatever ranking the queue has when it loads in the morning is what the team works that day.
ICP analysis on closed-won deals showed a clear pattern: prospects already using a specific accounting product converted at a meaningfully higher rate than the rest of the queue. They had the workflow, they had the budget line, they had the friction-fit. The team wanted to prioritise them.
The friction: there was no list. Data vendors that track accounting-software adoption for small companies charge enough per record that the unit economics break at the top of a cold-outbound funnel. And with the dialler on autopilot, manual prospecting wasn’t an option. The signal needed to land in the queue itself, before the dialler picked up the first record.
The problem
Most SMB sales teams burn outbound capacity on companies that aren’t a fit. The signal that would tell them which companies to call first usually lives in a paid data vendor, an enrichment API, or a manual research workflow that doesn’t scale. The structural gap: public registry data is rich, free, and underused.
For this team specifically:
- The CRM had labelled outcomes for companies known to use the target software and companies known to use a competitor. There was no way to score new prospects against those labels.
- Buying the signal externally cost more per record than the expected revenue per dial.
- The dialler ran on autopilot. Manual prospecting before the queue loaded would have eaten the time-saving the autopilot was designed to give. Whatever ranking the queue had at 9am was what reps worked that day.
Can the label be predicted from public Danish company-registry data alone, well enough to reorder a dialler queue automatically every morning?
The approach
Four problems the model had to solve:
Predict. Get an accuracy that’s worth deploying. Not 99%, not “high accuracy.” A real number on a real holdout. Anything that meaningfully outperforms random gives the team a queue reorder worth caring about.
Explain. A sales rep working a flagged lead wants to know why the model flagged it. Black-box scores get ignored. The model needs to surface, per prediction, which features pushed the score up.
Calibrate. Picking 0.5 as the threshold is the default but rarely the right call. A score of 0.7 should mean roughly a 70% positive rate. The operational question is “if I act on the top N records, how many of those are right?” That’s a precision-recall question, not an AUC question.
Deploy. The model has to land in the lead-scoring pipeline where reps actually work. Not a notebook. Not a one-off scoring run. A monthly retraining loop tied to new labelled outcomes arriving in the CRM.
The build
The data model. Before any modelling, the training table had to be right. I designed a single flat table joined from:
- The public CVR registry (company form, founding date, employee band, VAT cadence, industry NACE code, region)
- The CRM’s labelled outcomes (companies known to use the target software, companies known to use a named competitor)
The schema is normalised. Each row is one company, one label, one timestamp. No duplicates, no future information leaking into past records. Categorical columns typed as enums so the same value can’t appear in five spellings.
The model. XGBoost binary classifier on 14 cold-observable features. 4,658 deduplicated training rows. The split between positive (uses target software) and negative was almost balanced at 2,275 vs 2,383. No class weighting needed.
Why XGBoost over logistic regression. Logistic regression assumes additive log-odds and handles feature interactions only through manual engineering. Tree ensembles pick interactions up natively and tolerate the mix of categorical and numeric features. I trained both. The tree ensemble landed roughly 5 AUC points higher on the same holdout.
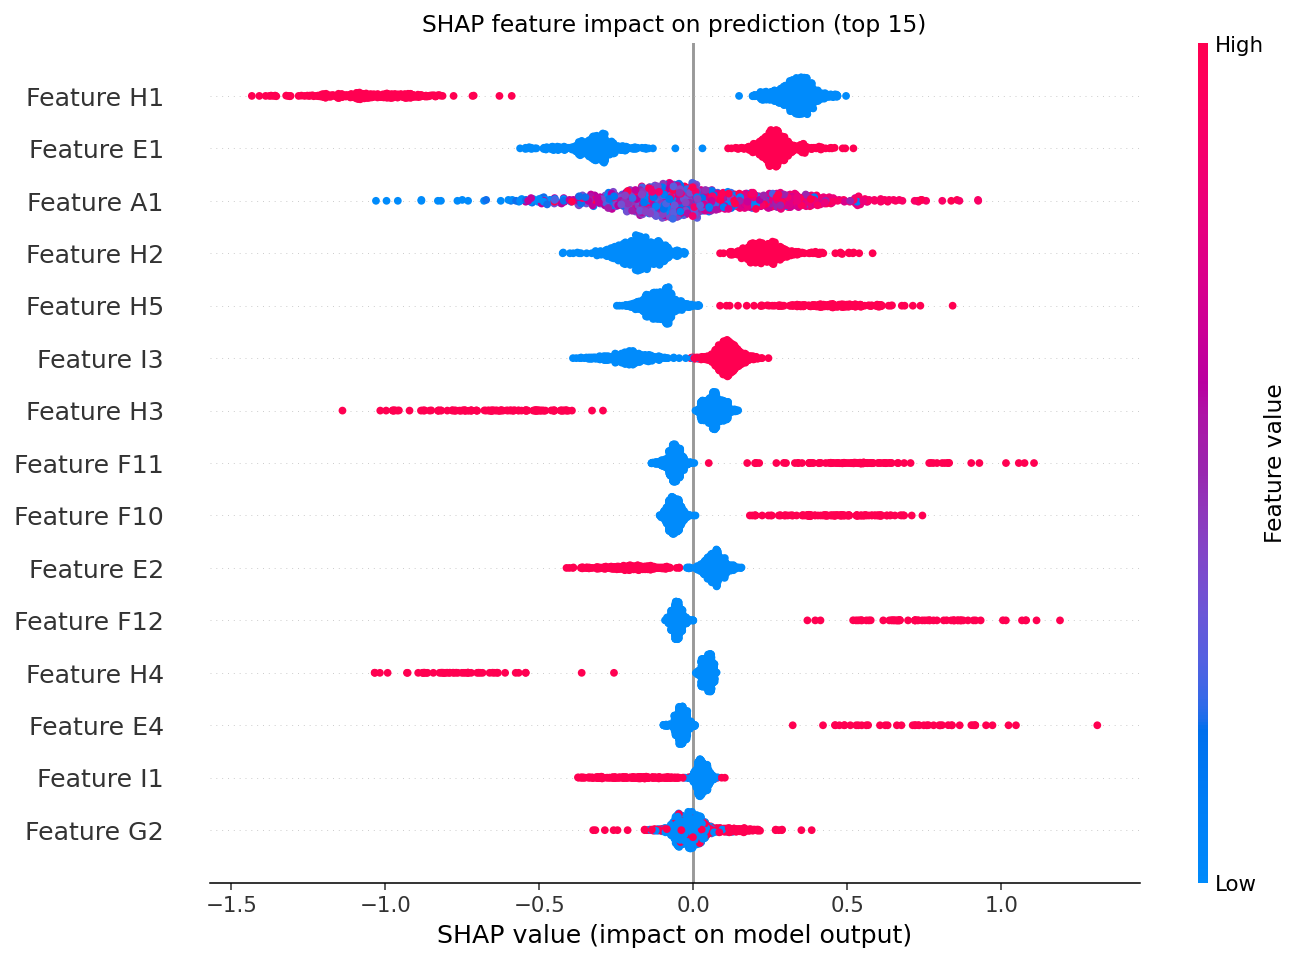 SHAP impact distribution per feature. Each dot is one prediction. Position on the x-axis shows whether that feature pushed the score up (uses target software) or down. Colour shows the feature value. Feature names are anonymised in the public version. The real schema is grouped by company size, legal form, age, industry, and filing cadence.
The evaluation. I evaluated the model at five levels, not just AUC:
- ROC and AUC. Holdout AUC 0.7475, cross-validation 0.7046. Permutation test p < 0.0001. The model is meaningfully better than random.
- Confusion matrix at threshold 0.5. False-positive rate inside acceptable range for downstream use.
- Precision-recall. Top-decile precision answers the operational question.
- Probability calibration. A score of 0.7 should mean roughly a 70% positive rate. If miscalibrated, the +15 score boost downstream gets miscalibrated too.
- SHAP feature importance. Top-15 features by SHAP value, plus per-prediction explanations for the team’s edge cases.
The top features are unsurprising on their own: employee band, company form, VAT cadence, industry, company age. What matters is how they combine. A new private-limited with five employees filing quarterly VAT in an IT-adjacent industry scores very differently from a twenty-year-old sole trader in trades.
The outcome
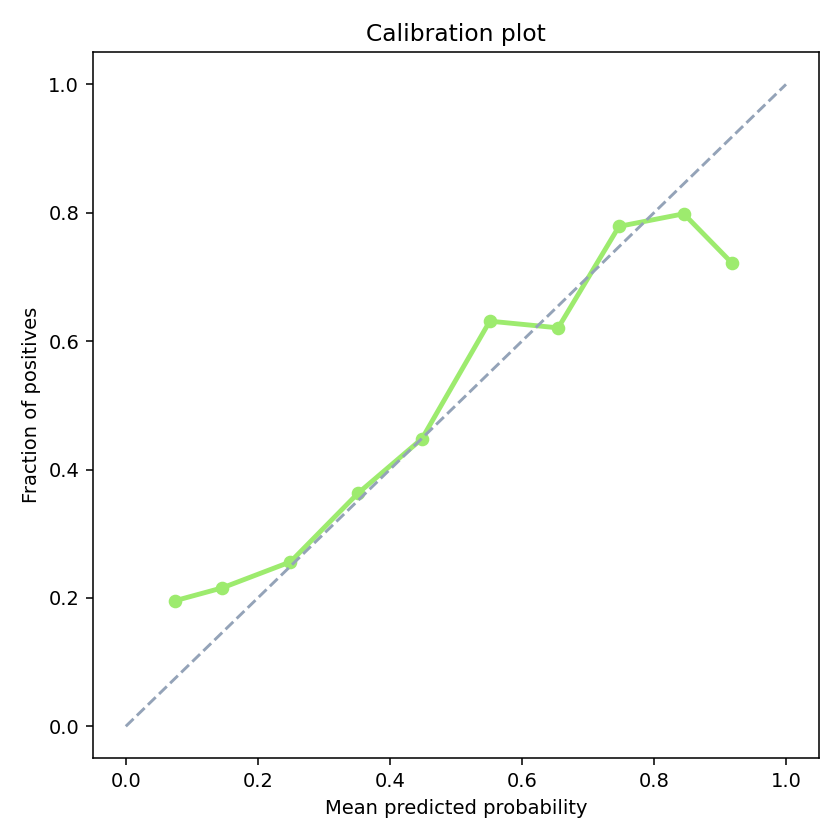 Calibration check. Predicted probabilities track actual positive rates closely enough that the downstream score boost stays honest.
The model sits inside the lead-scoring pipeline. Companies above threshold get a +15 score boost before they reach the dialler queue. The dialler runs on autopilot, so the queue order is what gets worked. Every morning, the highest-probability prospects move to the top automatically. Retraining is monthly, triggered by a GitHub Actions workflow that fires when new labelled outcomes arrive in the CRM.
No manual prospecting was added to the workflow. The dialler started spending its first hours on the segment ICP analysis flagged as the highest-converting, with no paid data vendor and no extra step in the reps’ day. One person built it.
One honest gap: I can’t put a conversion-lift number on the deployed model. The historical per-dial conversion data needed to measure whether the reorder actually moved revenue wasn’t available, so the impact is the reorder itself, not a quantified lift. Measuring that lift is the first thing the business should do next, and it’s cheap to do (see below). Claiming a revenue number I didn’t measure would be the wrong call here.
What the business should do next
The model earns its keep by reordering the queue, but the team isn’t measuring what that reorder is worth yet. The recommendation is one quarter of disciplined logging: tag every dial as flagged or unflagged, record the outcome, and at the end of the quarter compare the conversion rate of the two groups. That single number, the lift on a flagged dial versus an unflagged one, tells leadership whether the model is moving revenue or just moving rows. If the lift is real (and the holdout says it should be), the next move is to push the score boost higher so the flagged segment dominates the first calling hours of every day, when reps are sharpest. If it isn’t, the logging will say so cheaply, before anyone has bet the outbound strategy on it. Either way, the team replaces a model assumption with a measured business fact for the cost of one tracking column.
What I’d do differently
The first version was a 3-class model. I wanted to distinguish three accounting products at once. The two minority classes were indistinguishable from cold registry features alone. The model collapsed to AUC 0.527, barely above random. I dropped to binary (target product yes/no), which unlocked the full 4,658 training rows and gave the model something it could actually learn.
One feature, has_revisor (whether the company has an external auditor on file), only had 4,241 of 4,658 rows populated. I imputed the missing 8%. If I rebuilt the pipeline I’d scrape the missing records from the CVR website directly before training, not after.
The threshold was picked on F1. The honest call would have been to pick it on expected revenue uplift per dial, which is what the team actually cares about. I didn’t have the historical conversion data to do that cleanly. Next iteration: log every flagged-vs-unflagged dial outcome for a quarter, then re-pick the threshold on lift, not F1.
Tools
Python and pandas for the data work. scikit-learn for the splits, the cross-validation, and the calibration check. XGBoost for the model. SHAP for explainability. PostgreSQL for the training-data warehouse. GitHub Actions for the monthly retraining cron. The public reproduction trains on a synthetic 5,000-row CVR-style dataset regenerable from a single script, with no real company data.
Want the technical deep-dive? Full code, queries, and reproducible analysis live on GitHub.
View on GitHub →